

406.587.4531
simmental@simmgene.com
406.587.4531
simmental@simmgene.com
What Happens When You Use the Updated Indexes for Selection?
by Dr. Elizabeth Dressler, ASA Lead Geneticist
The American Simmental Association updated the economic selection indexes, $API and $TI, on November 10, 2026. The key updates made were direct incorporation of new EPDs; bringing the index simulation, or calculation, in-house to IGS; and updates to the economic assumptions and accounting of heterosis.
Many will naturally ask, “How does my individual animal’s updated index value compare to their previous?” While a comparison of updated and previous index values won’t be meaningful, a comparison of updated and previous index percentile ranks can help describe changes for individual animals.
However, to understand the index updates, a more informative question to ask is “If I use the updated index values to make selection decisions, how will the resulting genetic progress compare to selection using the previous indexes?” This question can be answered with the following Response to Selection graphs.
These graphs show the expected response in EPDs included in the updated indexes, given that Simmental breeders utilize the updated indexes for selection to the same degree as they did the previous indexes. In other words, if you use the updated indexes for selection decisions in the same way you used the previous indexes, how do the responses in EPDs compare? That is ultimately the purpose of economic selection indexes: they provide breeders with one value to guide selection decisions while driving progress in multiple different EPDs simultaneously. These Response to Selection graphs provide more insight into the practical implications of the index updates, or what the index updates mean for selection.
All-Purpose Index ($API)
To interpret the following graphs, compare the height of the blue bars (previous $API) to the gray bars (updated $API) for each EPD. This tells you how the response to selection for the updated $API compares to the previous $API across the traits.
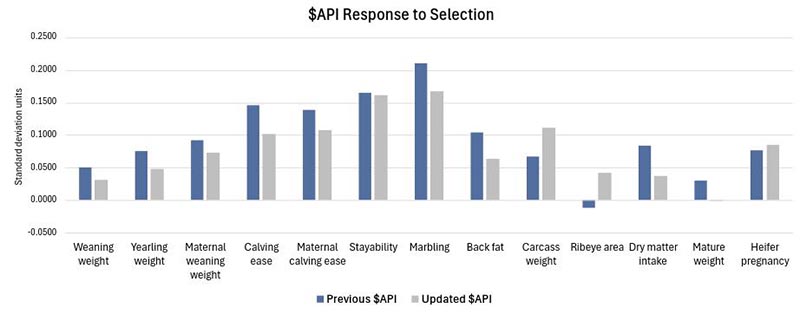
If the updated $API is used like the previous $API was, you can expect less response in early growth traits, calving ease direct and maternal, marbling, backfat, and dry matter intake. It’s important to understand that this does not mean that selection for the updated $API will cause these traits to worsen. They will continue to improve, but at a slower rate than the previous $API. We aren’t pressing the brake pedal on marbling, we are letting off the accelerator slightly.
For Stayability, the expected response is very similar between the previous and updated $API. As an all-purpose index, $API places emphasis on both maternal and terminal traits, with approximately half the emphasis on each. Stayability remains a priority in the updated $API, and breeders can expect to see a similar response for this trait as you did using the previous $API.
You can expect a greater response in carcass weight, ribeye area, and heifer pregnancy with the updated $API. For mature weight, the gray bar for updated $API is barely visible, hovering around zero. This means selection using the updated $API is expected to keep mature weight relatively steady. While the previous $API allowed mature weight to increase, the updated $API maintains mature weight while allowing for balanced increases in growth and carcass weight. You can use the updated $API without fear that it will cause your cows to get “too big” or “too small.” After using $API for initial selection, seedstock producers can always use the mature weight EPD to further refine selection based on environmental or operational requirements.
Terminal Index ($TI)
The Response to Selection graph for $TI shows the seven traits directly included in the index. $TI evaluates sires for use on Angus females, with all offspring put on feed and sold on a grid. Therefore, $TI focuses on traits that influence the value of the finished product. If the updated $TI is used for selection like the previous $TI, you can expect less response in post-weaning gain, marbling, and dry matter intake. Again, this does not mean post-weaning gain, marbling, or dry matter intake will worsen with selection for the updated $TI. They are still expected to improve, or see genetic progress, but at a slower rate than the previous $TI.
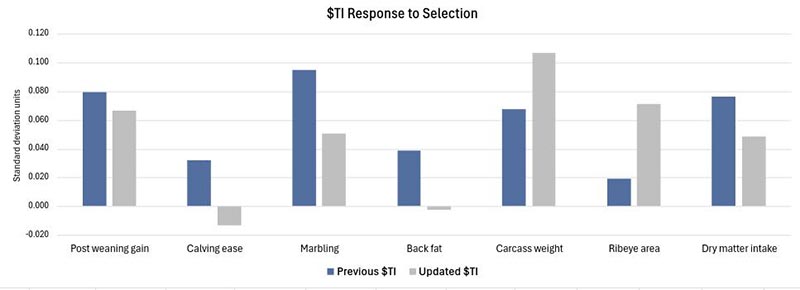
You can expect a greater response in carcass weight and ribeye area with the updated $API. The assumptions built into the index for phenotype means and economic pricing came from industry data including CattleFax and the US Meat Animal Research Center. These updates help to better align $API and $TI with the current and future beef market.
Subscribe to our weekly eNews, Eblasts, Sales Call
Subscribe to eNews ASA's weekly newsletter.
Sales Call: Calendar of upcoming sales and
eBlast: Sales and other industry promotions